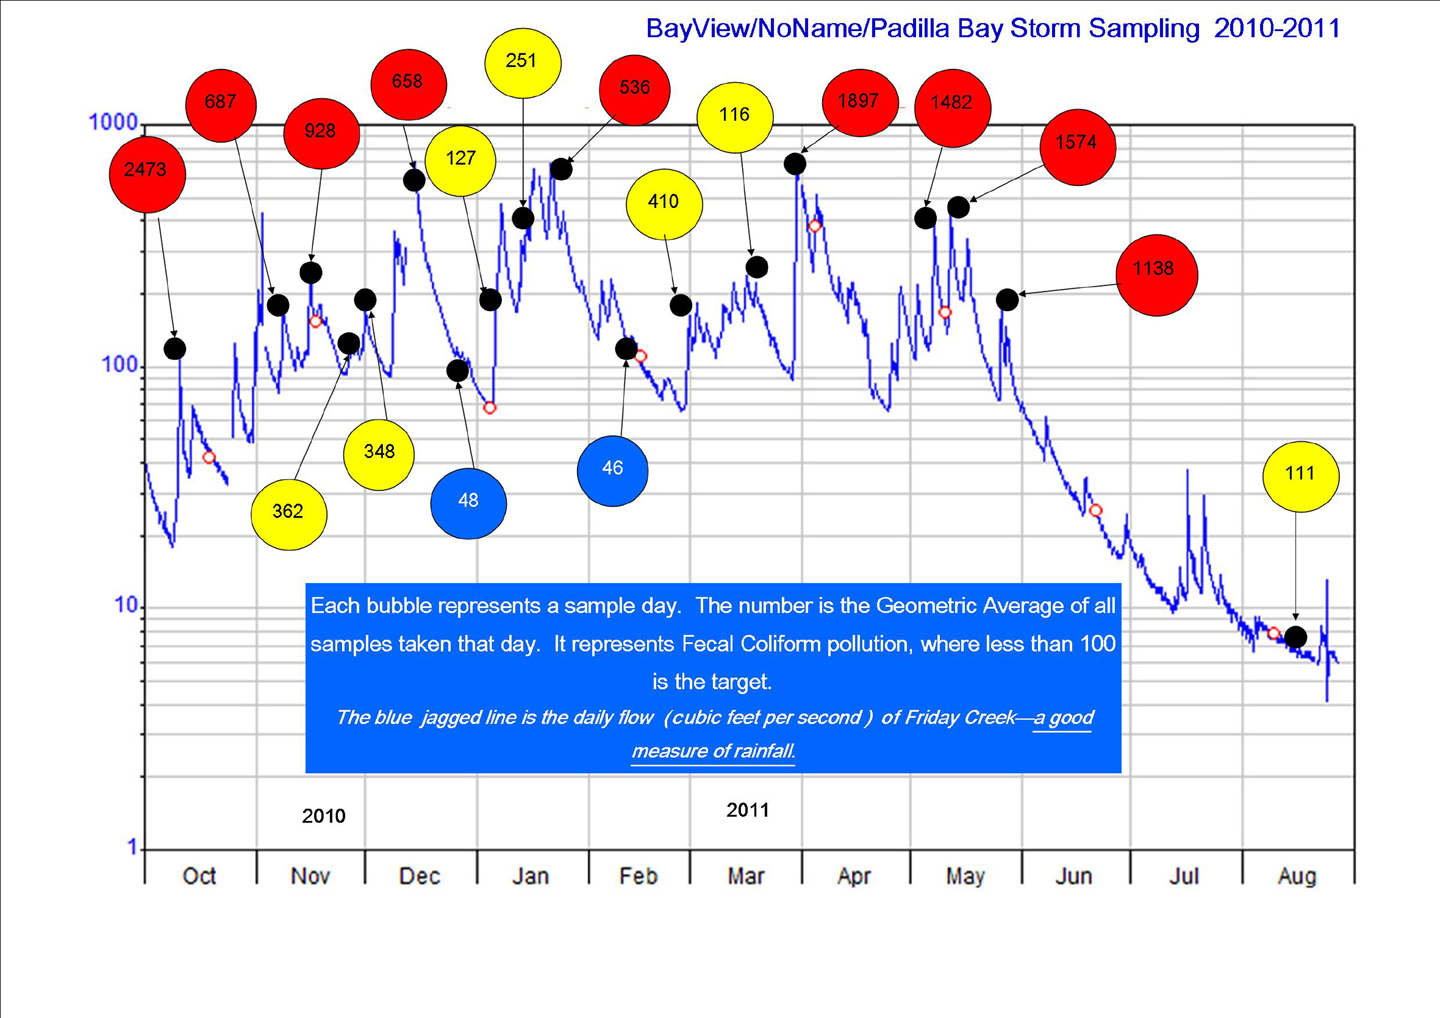
Bay View/NoName average fecal coliform data from 18 sample days: 2010-2011
Each little black dot is a sampling date. Click on any one of them to see the details of that sampling date.
The jagged blue line is a representation of how much rainfall was happening.
A large, colored dot shows the average fecal coliform level from all sample locations on that sampling date. Blue is at or below the required State Standard of 100. Red is VERY high.